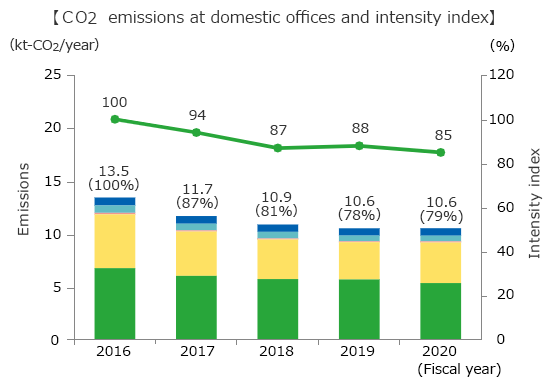
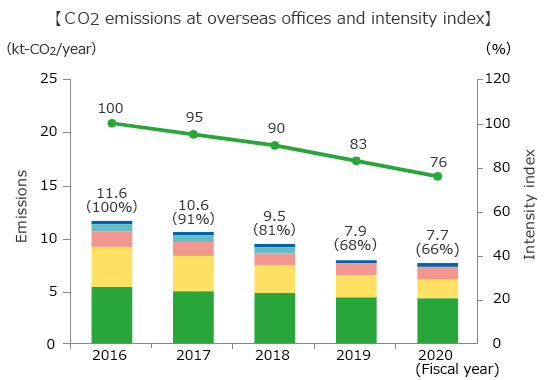
Improvements in CO2 Emission Intensity
In the 2020 fiscal year, we improved our CO2 emissions intensity to 85% at
domestic offices and to 76% at overseas plants compared to the 2016 fiscal year.
We’re striving to improve efficiency by introducing high efficiency lighting and air
conditioning equipment; changing and repairing aging pipes; reducing operating duration of
production facilities; and consolidating workplaces. We will strive to further reduce
CO2 emissions and improve environmental performance.

- Headquarter, branch, etc.
- Sankyo Diamond Industrial Co., Ltd.
- Koki Manufacturing & Service Co., Ltd., Shirako Logistics Center
- Sawa Plant
- Katsuta Plant
- Domestic performance of intensity (compared of FY2016, index)

- Taiwan Hikoki Co., Ltd.
- Guangzhou Hikoki Co., Ltd.
- Guang Dong Hikoki Co., Ltd.
- Hikoki(Malaysia) Sdn. Bhd.
- Fujian Hikoki Co., Ltd.
- Domestic intensity performance (compared of FY2016, index) (excluding India)
Goals and Results of Our Activities
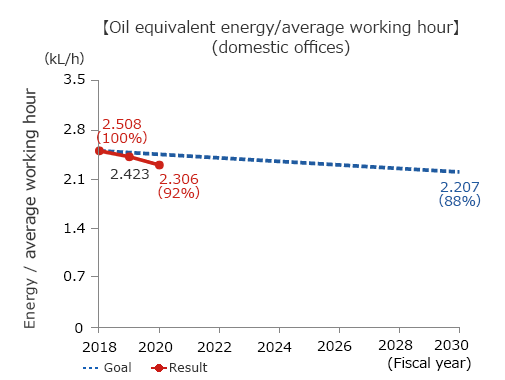
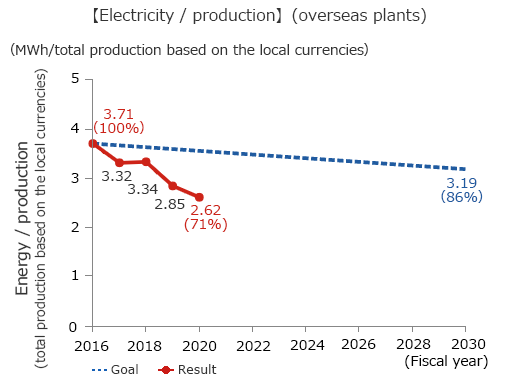
We’re seeking to achieve the new goal of improving the oil equivalent energy / average employee working hours (intensity)—in place of the former goal to improve the oil equivalent energy/production (intensity)—at domestic offices, and to improve electricity/production (intensity) at overseas plants. The goals and results are as shown below.
-
Reduction of Oil Equivalent Energy/Production (Japan)
At domestic offices, we’ve committed to improving oil equivalent energy/production. But in recent years, the shift to overseas production has increased the ratio of fixed energy consumption to total energy consumption. In response, based on a new theme highlighting the oil equivalent energy / average employee working hours, we’re striving to achieve 12% reductions from fiscal year 2018 by fiscal year 2030.
In fiscal year 2020, the first year of the activities, we continued our work on the integration of workplaces and facility operations, the introduction of various high-efficiency equipment, and the reduction of air leakage and other losses, as well as reducing numbers of servers and other fixed-use equipment, transferring production to overseas locations, and responding to the COVID-19 pandemic (remote work and temporary closure of shared facilities). These efforts resulted in an 8% decrease from fiscal year 2018. Since these outcomes include many temporary factors, we will continue to improve our efficiency into the future.
-
Reduction of Electricity/Production (Overseas Plants)
At plants outside Japan, we’re committed to reducing electricity/production and striving to achieve 14% improvements from fiscal year 2016 by fiscal year 2030.
In fiscal year 2020, we took various actions to improve profitability, including introducing high efficiency lighting and air conditioning equipment, monitoring departments via IoT, continuously improving work efficiency, and reviewing production bases. As a result, we achieved 29% reductions from fiscal year 2016. In fiscal year 2021, we plan to promote activities through further rationalization.
